In today’s data-driven world, visual representation of information is necessary. Bar graphs have become indispensable across industries. AI bar graph generators have revolutionized how we design, customize, and present data.
Key Takeaways
AI Bar Graph Generators revolutionize data visualization:- Automated Visualization: AI-powered tools transform complex data into clear, customizable bar graphs across various industries, making information instantly comprehensible.
- Versatile Applications: From corporate analytics to healthcare monitoring, these generators provide intuitive visual representations that enhance decision-making and communication.
- Customization Capabilities: Users can easily personalize graphs with brand-specific fonts, colors, and styles, creating visually engaging and professional data presentations.
- Simplified Data Interpretation: AI bar graph generators simplify complex statistical information, making it accessible for academic, business, and public sector audiences.
Read this article to understand what is bar graph and what are the top AI bar graph generators in 2024.
To avoid AI detection, use Undetectable AI. It can do it in a single click.
Table of Contents
What is Bar Graph?

A bar graph, sometimes referred to as a bar chart, is a technique for visualizing data that compares information across many groups or categories. Numerical values for data category levels are displayed using bars that can extend either vertically or horizontally.
These bars are plotted on two axes, one of which represents the numerical values and the other of which represents the categories.
Why Use Bar Graphs?
In a bar chart, the categorical data’s value increases with the length or height of the bar. Because of this, it’s useful for comparing different data sets or showing how data changes over time.
A bar chart can offer data insights in a clear and appealing visual manner, whether you’re comparing sales of various items, presenting poll findings, or showing cost swings over time.
Top AI Bar Graph Generator(s)
Popupsmart AI Bar Graph Generator

Popupsmart AI Bar Graph generator is an easy-to-use application that uses artificial intelligence to generate bar graphs for you. Bar Graph Maker AI is useful if you have data or numbers you want to present to people in a way that they can understand fast.
The application uses intelligent technology to create a clear, colorful graph that you can share online or use in reports and presentations. Everything you have to do is supply the data. It’s an easy approach to make your data appealing and easily comprehensible at a glance.
Visme AI Bar Graph Generator
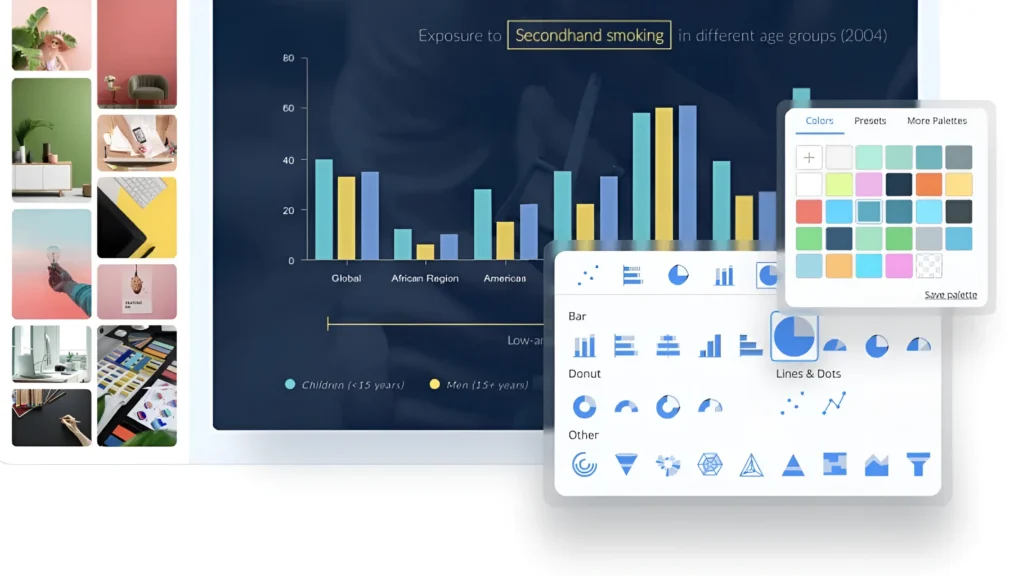
Use Visme’s user-friendly free AI bar graph generator to create a bar graph in a matter of minutes. Make the custom chart uniquely yours by adding your brand’s fonts and color-coding your data.
Alternatively, just enter your data into one of pre-made templates. Data visualization is made easier with Visme’s bar graph builder, which enables you to alter your template as much or as little as you prefer.
LiveChatAI AI Bar Graph Generator

LiveChatAI AI bar graph generator assists you in creating charts with target content. Even if values and statistics are valuable, it is beneficial to publish them attractively in any type of post. LiveChatAI would save you time and effort. The AI would the values and categories for you, so you don’t need to bother about it.
To accomplish this, just copy and paste the desired content into the LiveChatAI Content box, then press the button. In just a few seconds, your bar charts would be stable and ready to display visually engaging content.
Read Also: AI Pedestrian Detection Systems in 2024
Use Cases of AI Bar Graph Generators

AI Bar graph generators finds its uses across various domains:
Corporate analytics and business reports: A company may show quarterly sales data across various locations using AI bar graph generators. Stakeholders can quickly spot growth regions and expansion prospects by comparing the sales numbers from different branches in a bar graph that is shown in their annual report.
This is useful in industries such as manufacturing, retail, and finance, where strategic planning and decision-making are improved by visual representations of performance measures.
Educational and academic presentations: To demonstrate statistical data in their thesis, such as the frequency of different psychological occurrences seen during a field research, a university student could use AI bar graph generator.
The technique is quite useful in academic settings since it simplifies complicated data into formats that are easy to comprehend, which helps with research presentations and teaching.
Market research and consumer analytics: AI bar graph generator can be used by a market research company to illustrate consumer preferences across several categories, such as preferred features of the newest smartphones.
Businesses in the tech sector can quickly identify trends and patterns with the help of these insights, which are displayed in bar graph form. For marketing teams, product developers, and strategic planners who want to stay abreast of customer attitudes and market developments, these graphic becomes indispensable.
Public information and community engagement: Bar graphs can be used by local government entities to communicate information on the distribution of resources, including budgets for public services. This transparent style encourages civic engagement and helps locals understand how money are being spent.
This is helpful in the fields of social work and public administration, where open communication promotes public involvement and builds trust.
Healthcare monitoring and management: Hospitals might use AI bar graph generator to display patient data over time, including the amount of admissions associated with particular conditions.
This graphic approach can help with improved resource management and preventive measures by highlighting patterns, such as seasonal surges in specific illnesses.
Conclusion: AI Bar Graph Generator
AI bar graph generators are transforming the way we visualize data. Their ability to automate, customize, and enhance the data visualization process makes them an invaluable asset.
Whether you’re preparing a business report or making an engaging presentation, these tools ensure your data tells a compelling story.
FAQs: AI Bar Graph Generator
What is an AI Bar Graph Generator?
An AI Bar Graph Generator is a tool that utilizes artificial intelligence to create bar graphs and other types of charts quickly and efficiently. It allows users to input their data and customize the appearance of the graph, making it easier to visualize complex information.
This type of graph maker can generate various formats, including vertical bar charts, histograms, and pie charts.
How does an AI Bar Graph Maker work?
An AI Bar Graph Maker works by processing user-provided data through an AI-powered algorithm. The user can upload data via Google Sheets or input it directly into the platform.
The generator then analyzes the data and creates a bar chart based on the specified parameters, allowing for further customization such as colors, fonts, and labels. The output is a visually appealing and informative visualization that can be used for presentations or reports.
Can I customize my bar chart using an AI Bar Graph Maker?
Yes, majority AI Bar Graph Makers offer a range of customization options. Users can change colors, fonts, and styles to match their preferences.
In addition, you can adjust the data representation, such as creating a stacked bar chart or a custom bar format. This flexibility allows users to create charts that are not only functional but also aesthetically pleasing.
Is there a free bar graph maker available?
Yes, there are several free bar graph makers available online. Several of these tools offer basic features to create bar graphs without any cost. Users can access templates, generate graphs, and even create bar charts online without needing to pay.
However, some platforms may offer premium features for a fee, improving the functionality and design options.
