
Creating eye-catching presentations is now easier than ever, and you don’t need to be a wizard or a Photoshop expert to make it happen. With web-based tools like Piktochart, you can turn the mundane data from your reports into engaging infographics that capture attention.
Plus, Piktochart isn’t just for infographics; it’s also fantastic for crafting standout brochures and social media posts.
In this review, we’ve explored the depths of Piktochart, putting its various features to the test. Keep reading to discover who will benefit most from this versatile design tool.
Table of Contents
What is Piktochart?
Piktochart is a cloud-based tool for designing presentations that originated in Malaysia. Launched in 2012 by Goh Ai Ching and Andrea Zaggia, it quickly captured the market’s attention, drawing in over 170,000 users in its debut year alone. The Malaysian government, recognizing its potential, encouraged investors to back the startup, allowing it to proliferate.
As the platform evolved, its development team consistently introduced new graphic templates, keeping their focus sharply on making data visualization easy and effective. Today, Piktochart is utilized by more than 11 million users worldwide.
While there is a free version available, it comes with certain restrictions. To unlock all its features, users can opt for one of the premium subscriptions—something we did to give you a thorough review of what Piktochart has to offer.
How to Use Piktochart?
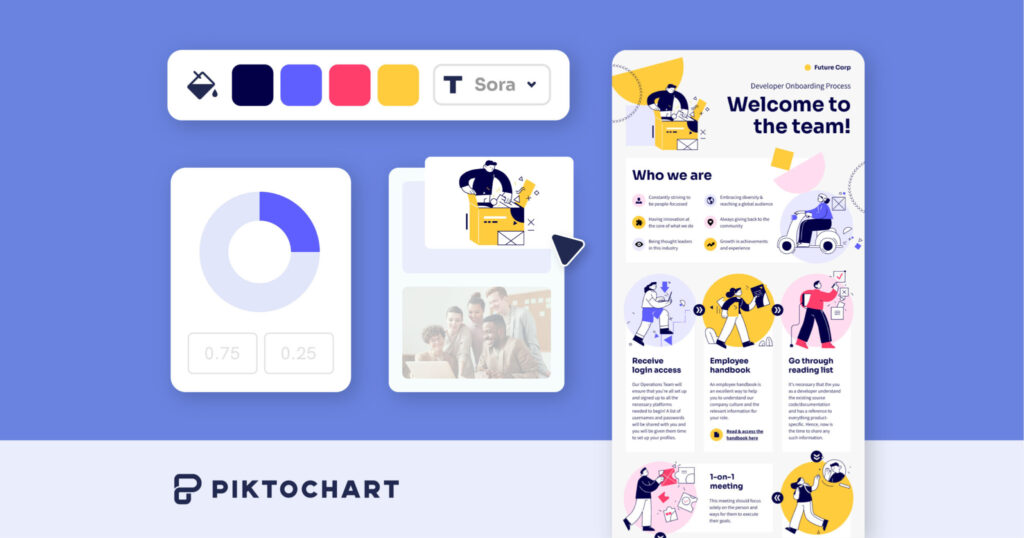
Piktochart shines when it comes to user-friendliness and versatility in creating visuals. Here’s how you can tap into its power through three main approaches—all impressively straightforward:
- Start From Scratch: Do you have a unique vision? Start with a blank canvas and let your creativity flow. You can choose from a variety of images, shapes, and elements, dragging and dropping them into your template. From there, customize each component to suit your design needs.
- Leverage Ready-Made Templates: Not everyone has a clear picture in mind, and that’s okay! Piktochart offers hundreds of templates to help get you started. Use the handy search function to find the perfect template that fits your project’s theme. Once you’ve made your choice, simply click to edit. You can adjust the design or tweak the text to convey your message just right.
- Use the AI-Powered Infographic Maker: For those who prefer a hands-off approach or need something quickly, Piktochart’s AI tool is a game-changer. Enter your requirements into the AI Generator, hit ‘Generate,’ and watch as it crafts a tailored infographic for you. You’ll get 4 to 6 designs to choose from, which you can use as-is or further customize. Once satisfied, download your creation as a PNG, PDF, or PowerPoint file, or even embed it directly into your website with a generated code.
Plus, if you ever need some guidance, Piktochart’s extensive library of YouTube tutorials covering anything you might want to create is just a click away.
Pricing
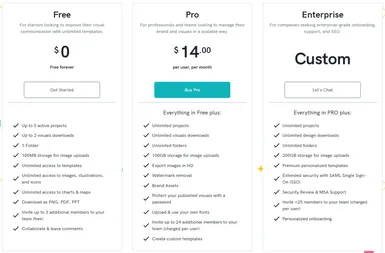
Piktochart offers two main pricing tiers: a Free plan at $0.00 and a Pro plan starting at $14.00.
When it comes to storage, the Pro plan might feel a bit limited, with only 100 GB available, while those on the Free plan get a mere 100 MB. Free users also face restrictions on the number of projects, capped at just five. Pro subscribers, on the other hand, enjoy the freedom to manage as many projects as they wish simultaneously.
The gap between the two plans becomes even more evident when it comes to downloads—Free users are allowed just two. Additionally, those not subscribing to the Pro version cannot customize with their own fonts or corporate colours. Regrettably, there’s no option to test drive the Pro features before committing. Overall, the value for price may not seem particularly impressive.
Support
Navigating Piktochart is generally straightforward, but if you ever hit a snag, there’s plenty of help available. The platform’s News blog is a good starting point for troubleshooting. If you need more direct assistance, Piktochart makes it easy to contact its support team. Just click the Help button located at the bottom right of every page to connect.
When you click this button, you’ll be taken to an FAQ section and a live chat window. If you find the solution to your problem, simply close the support area by clicking “Close.” During our review, we contacted Piktochart’s support team twice about some issues we encountered. We were pleased to find that our queries were resolved satisfactorily in just a few hours each time.
What Piktochart Can Do For You
Piktochart is more than just an online tool; it’s your all-in-one solution for creating visual and video content that stands out. Unlike typical infographic tools or PowerPoint, Piktochart is a versatile standalone platform that allows you to craft everything from detailed multi-page infographics with intricate data graphs to simple posters for your office.
Additionally, it’s equipped for creating and editing video content, perfect for social media clips or training videos.
Here’s a snapshot of what you can do with Piktochart:
- Standard Visuals: Whip up eye-catching posters from scratch in no time. Piktochart’s user-friendly interface means even beginners can create professional-looking visuals quickly.
- Presentations: Build sleek presentations using the same straightforward system, then download them as PowerPoint files ready for your next big meeting.
- Data-Based Reports: Whether it’s standard reports or full dashboards, you can build from scratch or modify templates to include your data. A standout feature is the ability to sync your figures with a Google Sheet on an interactive dashboard, which updates automatically as your data changes.
- Infographics: Piktochart excels in transforming complex information, like a company process, into clear and engaging infographics. This feature is perfect for making detailed data easy to digest and visually appealing.
- Video Content: Create and edit videos for social media or educational purposes. With Piktochart’s editing tools, manipulating video content is as straightforward as editing text, making it a breeze to produce polished, professional videos.
Pros of Piktochart
- User-Friendly Interface: Piktochart is renowned for its simplicity and ease of use, making it accessible for users with little to no graphic design experience.
- Versatility: With tools for creating infographics, presentations, posters, and videos, Piktochart serves a wide range of content creation needs.
- Extensive Template Library: Users have access to hundreds of templates, which simplifies the design process and inspires creativity.
- Integration Capabilities: The ability to sync data with Google Sheets for real-time updates is a powerful feature for creating dynamic and interactive reports and dashboards.
- Multi-Format Support: Users can download their creations in various formats like PNG, PDF, and PowerPoint, making it easy to share and present.
Cons of Piktochart
- Limited Free Version: The free version of Piktochart has significant limitations, including restricted storage and download capabilities, which might be a barrier for some users.
- Storage Limitations: Even the Pro version offers only 100 GB of storage, which may not suffice for users with extensive multimedia needs.
- Cost: The pricing for the Pro version might be a bit steep for individuals or small businesses with tight budgets, especially since there is no trial period to test all premium features.
- Learning Curve: While generally user-friendly, some users might find certain advanced features a bit challenging to master without going through tutorials.
- Customization Limits: Users who want to fully customize their designs might find the template-driven approach somewhat restrictive.
Conclusion
Piktochart stands out as a comprehensive and versatile tool for creating visually appealing and informative content across a variety of formats. Whether you’re crafting intricate infographics, engaging social media videos, or professional presentations, Piktochart provides a robust platform that caters to both beginners and seasoned designers.
Its user-friendly interface, combined with powerful features like the ability to sync data with Google Sheets and extensive template libraries, makes it an invaluable resource for anyone looking to enhance their visual communication. By streamlining the design process and offering a suite of easy-to-use tools, Piktochart empowers users to effectively convey their messages and captivate their audiences.
